Residential Real Estate News
U.S. Homebuyer Monthly Payments Up 20 Percent Annually in July
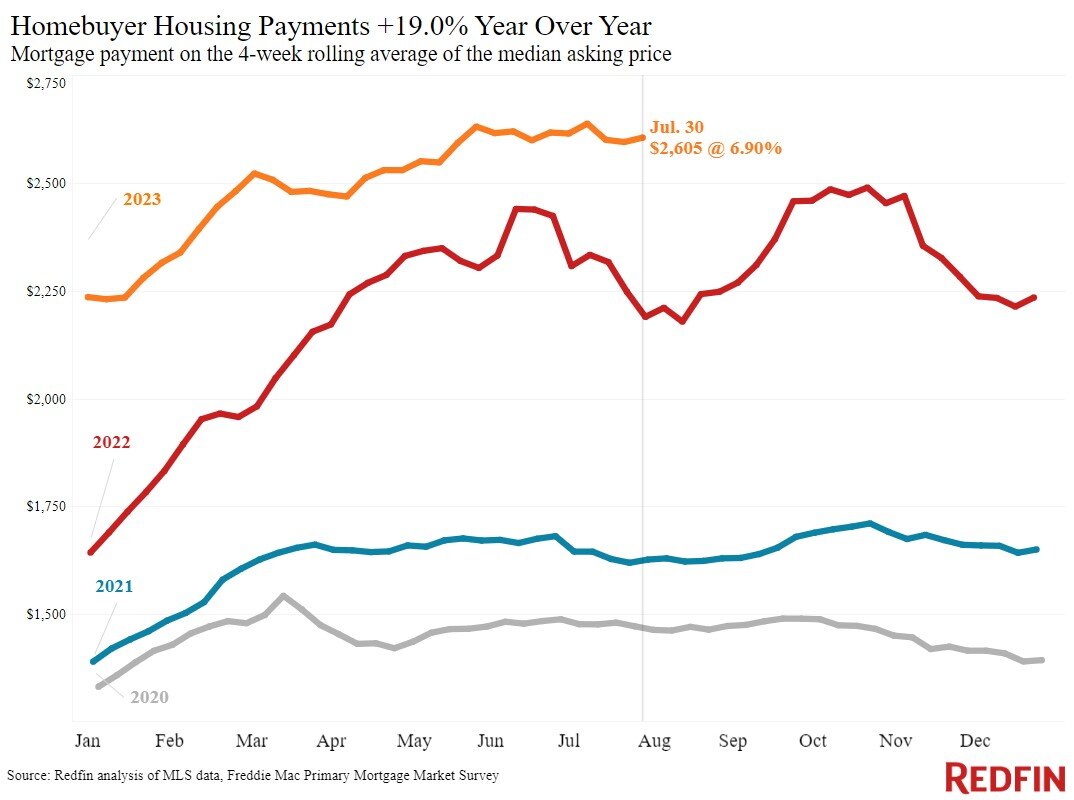
Based on new data from Redfin, the typical U.S. homebuyer's monthly mortgage payment was $2,605 during the four weeks ending in late July 2023, up 19% from a year earlier.
Housing payments remain historically high because mortgage rates remain elevated, with weekly average rates clocking in at 6.9% this week, and home prices are on the rise. The median home-sale price is up 3.2% year over year, the biggest increase since November.
Home prices are increasing because of the mismatch between supply and demand. High mortgage rates have pushed many would-be sellers out of the market, with homeowners hanging onto their relatively low rates. The total number of homes for sale is down 19%, the biggest drop in a year and a half, and new listings are down 21%.
High rates are also sidelining prospective buyers, but not as much as they're deterring would-be sellers. Redfin's Homebuyer Demand Index, which measures early-stage demand through requests for tours and other buying services from Redfin agents, is down just 4% from a year ago.
Leading indicators of homebuying activity:
- For the week ending August 3, the average 30-year fixed mortgage rate was 6.9%, slightly higher than a week earlier but slightly lower than the half-year high hit three weeks earlier. The daily average was 7.2% on August 3.
- Mortgage-purchase applications during the week ending July 28 declined 3% from a week earlier, seasonally adjusted. Purchase applications were down 26% from a year earlier.
- The seasonally adjusted Redfin Homebuyer Demand Index was down 4% from a month earlier, and down 4% from a year earlier.
- Google searches for "homes for sale" were up essentially flat from a month earlier during the week ending July 29, and down about 16% from a year earlier.
- Touring activity as of July 28 was up 8% from the start of the year, compared with a 5% decrease at the same time last year, according to home tour technology company ShowingTime.
Key housing market takeaways for 400+ U.S. metro areas:
- The median home sale price was $380,250, up 3.2% from a year earlier. That's the biggest increase since November.
- Sale prices increased most in Miami (12.7% YoY), Cincinnati (9%), Milwaukee (8.6%), Anaheim, CA (8.5%) and West Palm Beach, FL (8.4%).
- Home-sale prices declined in 19 metros, with the biggest drops in Austin, TX (-9.9% YoY), Phoenix (-4.2%), Detroit (-3.9%), Las Vegas (-3.5%) and Fort Worth, TX (-3.2%).
- The median asking price of newly listed homes was $387,223, up 1.7% from a year earlier.
- The monthly mortgage payment on the median-asking-price home was $2,605 at a 6.9% mortgage rate, the average for the week ending August 3. That's down about 1% ($32) from the record high hit three weeks earlier, but up 19% from a year earlier.
- Pending home sales were down 14.4% year over year, continuing a year-plus streak of double-digit declines.
- Pending home sales fell in all but two of the metros Redfin analyzed. They declined most in Providence, RI (-29.5% YoY), Newark, NJ (-28.8%), Warren, MI (-26.4%), Boston (-26.3%) and Cincinnati (-25.1%). They increased 3.5% in Las Vegas and were flat in Austin.
- New listings of homes for sale fell 21.3% year over year. That's a substantial decline, but the smallest in three months.
- New listings declined in all metros Redfin analyzed. They fell most in Las Vegas (-43.4% YoY), Phoenix (-39.7%), Providence, RI (-32%), Sacramento, CA (-31.9%) and Oakland, CA (-30.7%).
- Active listings (the number of homes listed for sale at any point during the period) dropped 19% from a year earlier, the biggest drop since February 2022. Active listings were down slightly from a month earlier; typically, they post month-over-month increases at this time of year.
- Months of supply--a measure of the balance between supply and demand, calculated by the number of months it would take for the current inventory to sell at the current sales pace--was 2.9 months, the highest level since April. Four to five months of supply is considered balanced, with a lower number indicating seller's market conditions.
- 43.7% of homes that went under contract had an accepted offer within the first two weeks on the market, up from 42% a year earlier.
- Homes that sold were on the market for a median of 27 days, up from 23 days a year earlier.
- 35.9% of homes sold above their final list price, down from 43% a year earlier.
- On average, 5.8% of homes for sale each week had a price drop, down from 6.3% a year earlier.
- The average sale-to-list price ratio, which measures how close homes are selling to their final asking prices, was 100%. That's down from 100.7% a year earlier.